Fatal Accident Frequency
The following chart illustrates the frequency of fatal Cirrus accidents and Cirrus Airframe Parachute System (CAPS) saves over the past 15 years.
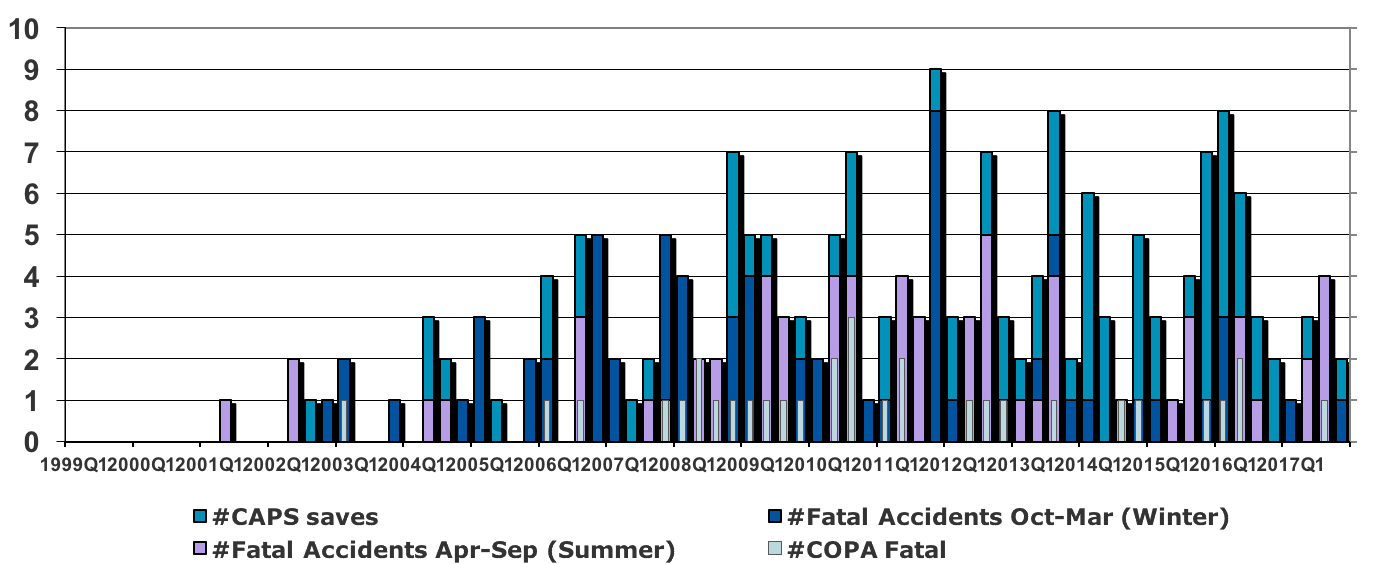
Each bar represents one quarter year, with red bars representing fatal accidents, green CAPS saves and yellow fatal accidents involving COPA members. Note that in the early years until about 2010, more fatal Cirrus accidents occurred in the dark half of the year (October to March) than in the light half of the year (April to September). The fall months of 2011 represents the worst three-month period with eight fatal accidents.
Also, note that over the past few years, the frequency of fatal Cirrus accidents grew less quickly than the increased size of the Cirrus fleet. Furthermore, the use of the CAPS has significantly increased in the past three years. Here is the frequency of fatal accidents and survivable CAPS deployments:

And the number of fatalities has also changed dramatically.

NOTE: Data compiled by COPA includes all known fatal accidents and survivable CAPS deployments in Cirrus aircraft world-wide, hence more than those investigated by the NTSB.